


Why your new tracking system feels broken
Most buyers come to purchasing with the same complaints: inconsistent location data, poor route adherence, messy maintenance records, and software that won’t scale. If your goal is dependable oversight, start by defining the failure modes you see today—late pickups, unplanned downtime, and unclear liability records. Begin your evaluation around school bus fleet management capabilities that directly map to those failure modes, not vendor feature lists.

Diagnose before you buy: a short checklist
Treat procurement like debugging. Ask for measurable outputs and test them against reality:
- Location fidelity: sample GPS traces over two heavily trafficked routes during peak hours.
- Event latency: measure time from door-open or seat-belt trip to platform alert.
- Maintenance signals: confirm whether CAN-bus fault codes appear in the platform and map to service actions.
- Data retention & export: ensure raw logs export to CSV/JSON without vendor-lock.
- Scale test: simulate 10× current fleet to see load behavior and costs.
Common root causes and straight fixes
Problems usually come from mismatched expectations, poor integration, or missing workflows. Fixes are practical:
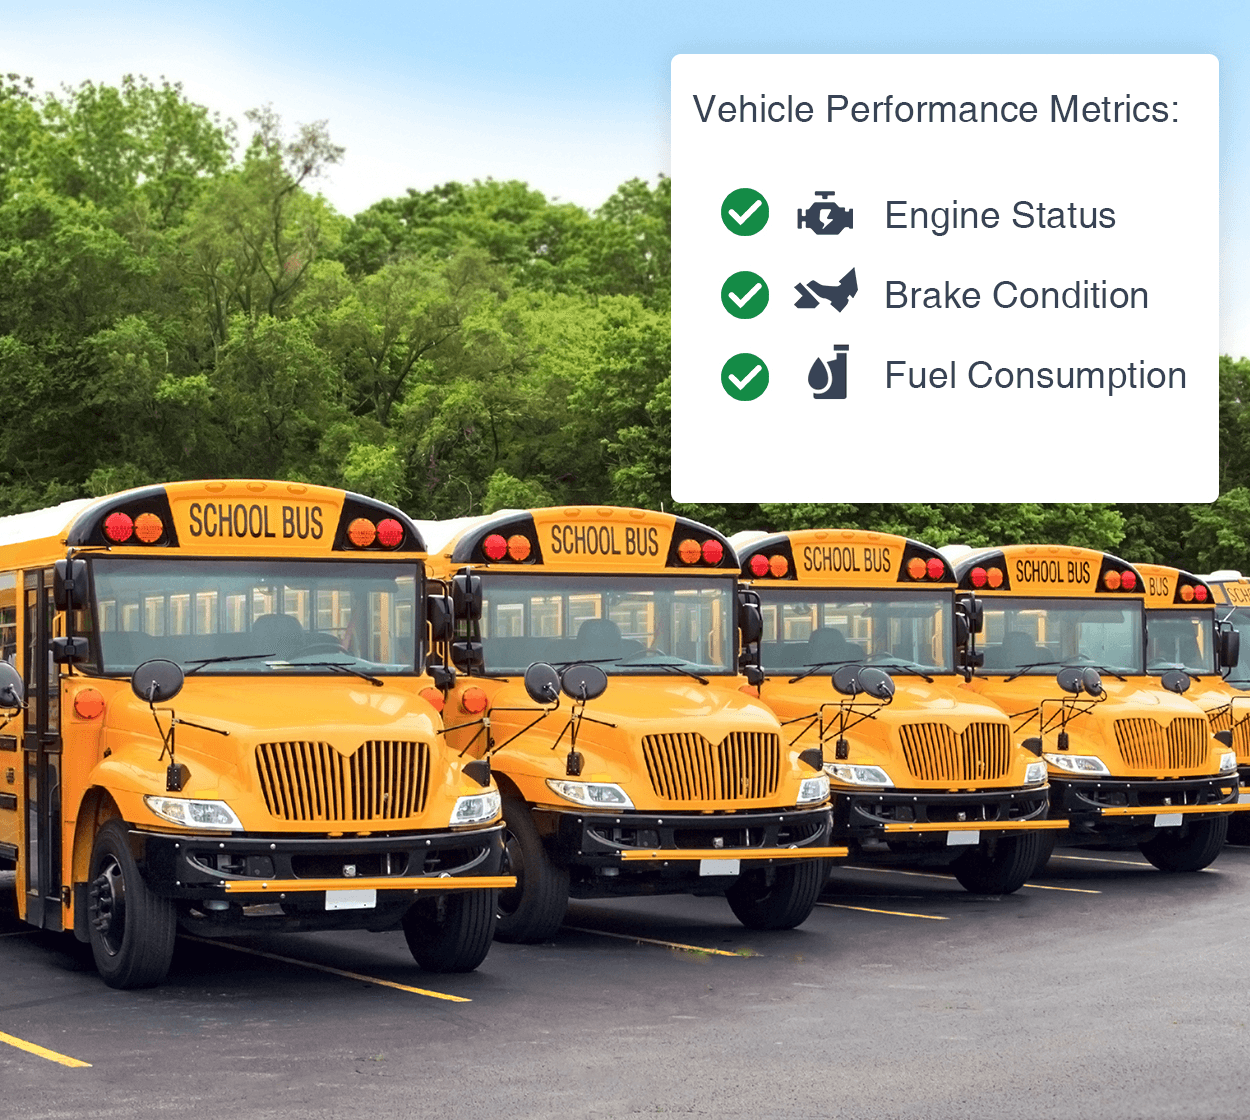
- Mismatched expectations — define KPIs (on-time %, mean time to repair) and require SLA language in the contract.
- Poor integration — demand API specs and a short sandbox integration window with your Student Information System (SIS).
- Missing workflows — map what happens when a bus breaks down and require that the platform supports that exact notification chain (driver → dispatcher → parent).
- Data noise — enable filtering and edge pre-processing so only validated telemetry flows to cloud, reducing false alerts.
What to evaluate in the platform architecture
As a cloud-focused reviewer, prioritize systems that separate concerns and scale predictably:
- Edge module: local collection, message batching, and OTA update capability.
- Ingestion layer: event queues with replay and back-pressure handling.
- Storage tiering: warm storage for recent telemetry, cold storage for historical audits.
- Analytics: a rules engine for simple alerts plus an ML inference path for anomaly detection.
- Access controls: role-based access and audit logs for each data read/write.
How vendors typically mislead buyers
Vendors often present polished dashboards while minimizing integration cost. Watch for these tactics:
- Demo-only features—ask for access to a live tenant with anonymized data.
- Undisclosed data fees—calculate costs at projected data volumes and retention windows.
- Limited upgrade paths—confirm firmware and protocol support for at least three hardware generations.
Comparing deployment models and alternatives
Three realistic options exist: full SaaS, hybrid (edge processing + cloud), and on-prem for regulatory needs. Quick comparisons:
- SaaS — fastest to deploy, best for districts without large IT teams; verify multi-tenant isolation.
- Hybrid — preferred when low-latency alerts matter; local logic avoids false positives during connectivity loss.
- On-prem — chosen rarely, only when policy demands local-only storage; expect higher operational overhead.
Also evaluate competing products by running side-by-side pilots on identical routes to measure real differences in route adherence and maintenance signal accuracy. Where sensor fusion matters, inspect whether the solution supports accelerometer + GPS + CAN-bus fusion—this is where school bus fleet management technology decisions show their true value.
Deployment mistakes that cause the most pain
Avoid these predictable errors:
- Skipping driver training—technology only helps if operators use it consistently.
- Poor change management—announce data policies and incident handling before go-live.
- No rollback plan—version control for firmware and server releases prevents a single bad OTA from grounding the fleet.
- Ignoring security—encrypt telemetry in transit and at rest; rotate keys and monitor access logs.
Metrics you must track from day one
Operationally useful KPIs are specific and actionable:
- On-time pickup rate (per route, per time window).
- Mean time to repair (MTTR) for vehicle faults surfaced by telemetry.
- False alert rate for safety events (doors, seat belts).
- Data delivery latency (95th percentile) from edge to dashboard.
Credibility check: real-world anchor
Lessons presented at the National Association for Pupil Transportation annual conference emphasize practical pilots, not promises—vendors who share anonymized pilot datasets are easier to trust.
Decision flow for procurement
Follow this concise flow when selecting a supplier:
- Define three binding KPIs tied to contracts.
- Run a 30–60 day pilot on representative routes with production drivers.
- Measure and compare pilot data against KPIs; require a written remediation plan for missed targets.
- Negotiate SLAs that include firmware support, data export, and service credits for missed uptime.
Final synthesis
Problems reveal priorities: pinpoint the single operational failure you must fix, test solutions under real load, and insist on architecture that separates edge, ingestion, and analytics. That approach reduces surprises and produces repeatable results the district can trust, which is why experienced teams often align technical requirements and procurement language with providers they can audit and iterate with, like BSJ.

