

Opening: define the decision variables
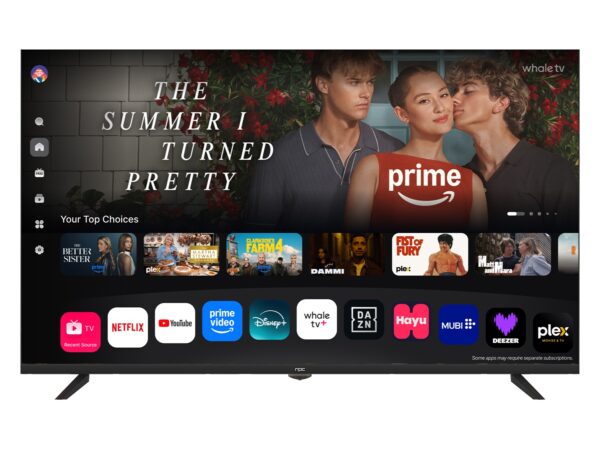
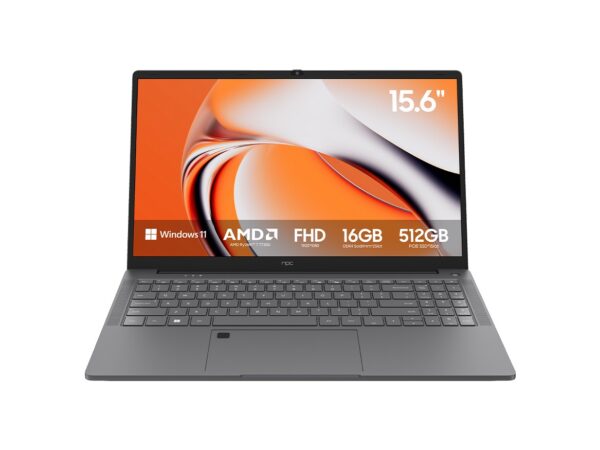
Retailers and integrators need a numeric playbook: unit cost, landed cost, defect rate, and replenishment speed determine profitability more than brand lore. Compare TV category KPIs against adjacent lines — for example, margins and return rates on peripherals or all in one computer deals — to decide where working capital will generate the highest ROI. Start with hard numbers, not anecdotes: if a shipment’s landed cost pushes gross margin below your breakeven threshold, skip the SKU regardless of perceived demand.
Key metrics to track (and target thresholds)
Measure these consistently: unit cost (USD), landed cost (%) = unit cost + freight + duties, defect rate (%) ≤ 2.0 for top suppliers, return rate (%) ≤ 3.5 for retail channels, lead time (days) median and 95th percentile, MOQ (units) relative to turnover, and forecast accuracy (MAPE) < 20% for steady SKUs. Use these benchmarks to filter vendors: a supplier with lower unit cost but 6% defect rate undermines margins and increases reverse-logistics spend.
Supplier scoring framework
Create a weighted score: Score = 0.30*LandedCostRank + 0.25*LeadTimeRank + 0.20*DefectRateRank + 0.15*WarrantySupportRank + 0.10*Sustainability/ComplianceRank. Normalize ranks 0–100; prioritize landed cost and reliability. Track the distribution of scores monthly and set a minimum acceptable score (e.g., 65). Run sensitivity checks: simulate a 10% freight spike or a 5-day delay and note how supplier rankings shift—this reveals fragile relationships before they break.
Real-world anchor and category signal
Major trade events influence pricing windows; for instance, product reveals and supply-chain announcements at CES in Las Vegas often correlate with short-term price adjustments across consumer electronics. When AIO systems and monitors are highlighted, shipping and component demand shift, which can affect TV procurement timing—cross-check those signals against current all in one desktop computer deals and adjust purchase timing accordingly.
Common pitfalls and how metrics catch them
Frequent mistakes: buying by MOQ alone, ignoring freight per-unit volatility, and underestimating reverse logistics. Detect these with simple rules: flag SKUs where forecast error (MAPE) > 25% for two consecutive quarters; flag suppliers whose defect trend increases quarter-over-quarter. Require suppliers to provide CTQs (critical-to-quality metrics) and sample test results; if test-fail rates exceed 1.5% in acceptance sampling, pause replenishment until corrective action is validated.
Alternatives and comparative insight
Option A: authorized distributors—predictable warranty, higher price, low defect risk. Option B: OEM direct—best per-unit cost at scale, longer lead times. Option C: accredited liquidators—deep discounts, higher variability and return costs. Quantify choices: compute total landed cost per sellable unit (including expected returns) and select the channel with lowest expected cost per sold unit given your service-level targets.
Implementation checklist
Operationalize with: a supplier scorecard updated monthly; a two-scenario procurement cadence (normative and disruption); contractual SLAs with penalty clauses tied to defect rate and lead-time percentiles; and a dashboard showing cash tied-up (days of inventory) by SKU. Use small pilot buys to validate assumptions before scaling MOQ commitments.
Summary synthesis
Make sourcing decisions by numbers: set measurable thresholds, score suppliers on consistent criteria, model downside scenarios, and prefer channels that minimize expected cost per reliable unit. That method reduces subjective guesswork and surfaces the suppliers and timing windows that matter — outcomes you can reproduce using the dataset and trade patterns available through npc.

